반응형

2024/03/25 8

X bar and S Control Chart

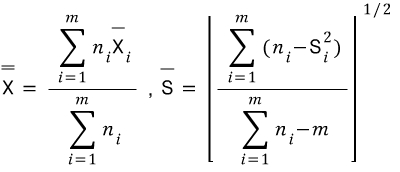
S chart 는 언제 쓰면 될까 ? 1) Sample size 'n > 10' 일 때 ( n이 10보다 작거나 같을 경우 R 차트를 사용하는것이 좋다) 2) Used for variable sample size => Subgroups have different sample size 1. X bar and S control chart with variable sample size (subgroup의 sample size가 다를 경우) m : # of samples/ subgroups ni : sample size for each samples/ subgroups * 각 subgroup의 sample size가 다르지만 , 하나의 고정된 컨트롤 리밋으로 작성하고 싶을 경우에는 ni의 평균을 사용하거나 가장..

Control Chart for x_bar and R

컨트롤 차트 , X_bar and R​ - Suppose (xij, i=1..m j=1..n} are normally distributed - X bar chart monitors between-sample variability (variability over time) X bar 차트는 샘플들 간의 변동성을 나타내고 R chart measures within-sample variablitiy (intantaneous variability at a given time) R 차트는 샘플내의 변동성에 대해 측정한다. 1. Control chart for X_bar and R - Known μ and σ - Range Ri = max (x_ij) - min (x_ij) for j=1.. n - μ and σ을..

Root Cause Analysis

* Root and Cause Analysis , Continuous Improvement - To prevent recurrence at lowest cost in the simplest way 발본색원의 개념, 근원이 되는 문제를 제거해서 비슷한 문제들이 다시는 발생하지 않도록 방지하는 것 - method to trace down RC: data mining hierachial cluster solution (GT data mining) 1) Root cause: removed; prevent undesireable outcome,the condition that enable one or more causes 2) Casual cause: affect an event's outcome, but not..

Basic Statistical Descriptions of Data

- Quartiles : Q1 (25th percentile), Q3 (75th percentile) - Inter-quartile range: IQR = Q3- Q1 - Five number summary : min, Q1, median, Q3, max - Boxplot : ends of the box are the quartiles; median is marked ; add whiskers (minimum and maximum observation) ​ and plot outliers individually ; whiskers : 박스 바깥쪽에 가로로 나있는 선, 최소값과 최대값을 표시 - Outlier : usually, a value higer/ lower than 1.5 x IQR ex) 30,..

Data Set, attributes

- Data set 은 data objects로 이루어져 있고 data object는 entity 를 표현한다. ex) sales database: customers, store items, sales medical database: patients, treatments - Data objects는 attributes에 의해 설명된다. - Database의 row는 data objects로 columns는 attributes를 나타낸다. - Attribute 의 종류에는 1) Nominal 2) Binary 3) Ordinal 4) Numeric: quantitative 가 있다. 1) Nominal : categories, states or symbols - Hair_color = {auburn, bl..

ECLAT

ECLAT: Frequent Pattern Mining with Vertical Data Format * 기존의 Tid 순으로 표현했던 것을 각각의 아이템별로 Tid list 를 표현해낸다. - (K+1) 의 itemset 의 후보가 되려면 모든 K-item subset 이 frequent 해야한다. - Apriori 와는 달리 1) support 를 계산 하는데 짧은 시간이 걸린다. 2) 교집합을 찾기가 쉽다. 하지만 intermediate Tid 리스트가 너무 많은 메모리를 차지 할 수 있다. ex) minimum support count = 2

반응형