컨트롤 차트 , X_bar and R
- Suppose (xij, i=1..m j=1..n} are normally distributed
- X bar chart monitors between-sample variability (variability over time) X bar 차트는 샘플들 간의 변동성을 나타내고
R chart measures within-sample variablitiy (intantaneous variability at a given time) R 차트는 샘플내의 변동성에 대해 측정한다.
1. Control chart for X_bar and R - Known μ and σ
- Range Ri = max (x_ij) - min (x_ij) for j=1.. n
- μ and σ을 알 때, R 차트의 기본적 토대는 아래와 같다.
1) relative range W = R/σ. W는 샘플사이즈 n을 따른다.
2) μ(w) = E(W) = d2, σ(w) = d3
(d2 와 d3는 appendix에 factors for constructing variables control chart 라는 이름으로 주로 별첨)
첨부파일 참조 !
3) μ(R) = d2 * σ, σ(R) = d3 * σ
4) R chart 의 control limit if k=3 (3 sigma control chart 일 때)

2. Control chart for X_bar and R - Unknown μ and σ
1) X bar chart (if k=3)

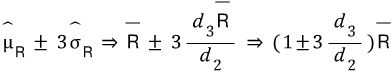
2) R chart (if k=3)
'산업공학 > Manufacturing' 카테고리의 다른 글
| Cost-benefit Analysis (비용편익분석) (1) | 2024.03.26 |
|---|---|
| X bar and S Control Chart (0) | 2024.03.25 |
| Root Cause Analysis (1) | 2024.03.25 |
| 2. Work place Ergonomics (0) | 2021.10.12 |
| 1. Takt time & Cycle time (0) | 2021.10.09 |


