* CUSUM Control Chart 를 사용하는 motivation
: To expedite detection of a small mean shift in process
기존 Shewart chart 는 small mean shift detection (σ<1.5)에 많은 시간이 걸린다. 또한 supplementary sensitizing rule를 사용 함으로써 sensitivity 를 증가 시키지만 반대로 Type 1 error 를 높히기도 한다.
* CUSUM chart
: directly incorporates all the information in the sequence of sample values by plotting the cumulative sums (CUSUM)
of deviations of the sample values from a target value

: All the past data are EQUALLY important => equal weight
* How to construct a CUSUM control chart: 1. Tabular (algorithmic) CUSUM (preferable way)
2. V-mask form of CUSUM
* Tabular (algorithmic) CUSUM

C+/C- : One side upper/ lower CUSUM , (Positive mean shift 를 찾을 때는 C+를 negative mean shift를 찾을 때는 C- 를 사용한다.)
=> Noise가 있을 수 있으므로 (μ+K) 보다 크거나 (μ-K) 보다 작아야 인정해 주겠다.
K = reference value (allowance or slack value)
* Decision Rules :
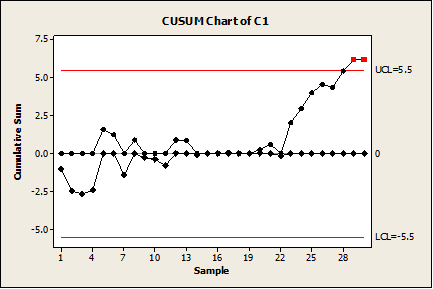
- If either C+ or C- exceeds the decision interval H (a common choice H=5σ), the process is considered to be out of control

Ex 9.1 in Introduction to Statistical Quality Control by Mongomery)
μ0= 10, subgroup size n=1, the process standard deviation σ=1,
and suppose that the magintude of the shift we are interested in detectiong is 1.0σ= 1.0(1.0) = 1.0.
Therefore, the out of control value of the process mean in μ1= 10 + 1 = 11.
K = 1/2 and H=5σ =5 (recommended value)
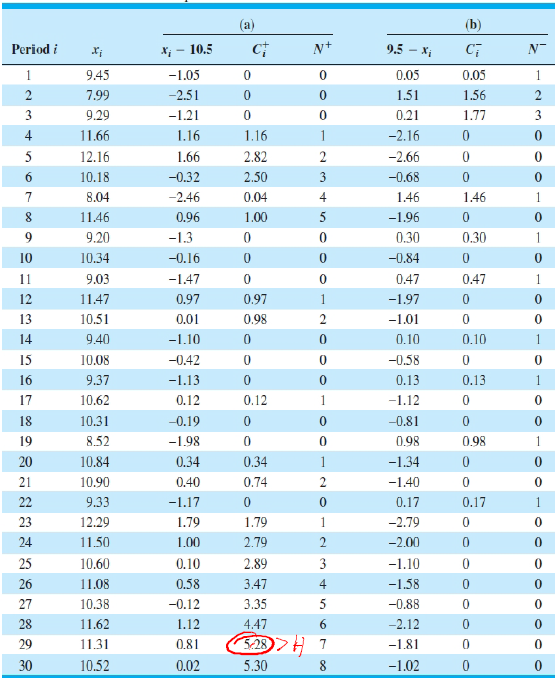
C1+ = max [0, x1 - 10.5 + C0+] = max [0, 9.45 + 10.5 + 0] = 0
C1- = max [0, 9.5 -x1 + C0-] = max [0, 9.5 - 9.45 + 0] = 0.05 이런식으로 계속 계산을 해 나갑니다.
N0+ 와 N0- 칼럼에는 Ci 가 연속적으로 해당되는에 따라 그 수를 기록합니다.
그리고 Ci의 값이 우리가 원하는 interval H를 넘어서는 period를 체크합니다. Ci > H => out of control
위의 표에서 그 값은 29번째 period에서 N0 = 7 입니다.
따라서 last in control period = 29 - 7 = 22.
즉, 22 와 23의 period 에서 shift가 일어 났을 것이라고 추정할 수 있습니다.
* Estimate the new process mean
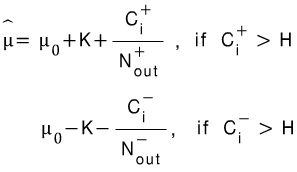
=> the new process mean = 10 + 0.5 + 5.28/7 = 11.25
* ARL of the CUSUM chart
- The most widely used ARL is the Siegmund's approximation
* For one-sided CUSUM


(Source: Introduction to Statistical Quality control 6th edition)
'산업공학 > Manufacturing' 카테고리의 다른 글
| Torx Screw & Torx Plus Screw (0) | 2024.04.01 |
|---|---|
| Gauge and Measurement System Capability (0) | 2024.03.26 |
| EWMA Control chart (1) | 2024.03.26 |
| Process Capability Analysis (0) | 2024.03.26 |
| Cost-benefit Analysis (비용편익분석) (1) | 2024.03.26 |


